Predicting sentiment from tweets
about U.S. airlines
Final Springboard Capstone Project - July 2020
Purpose and Goal
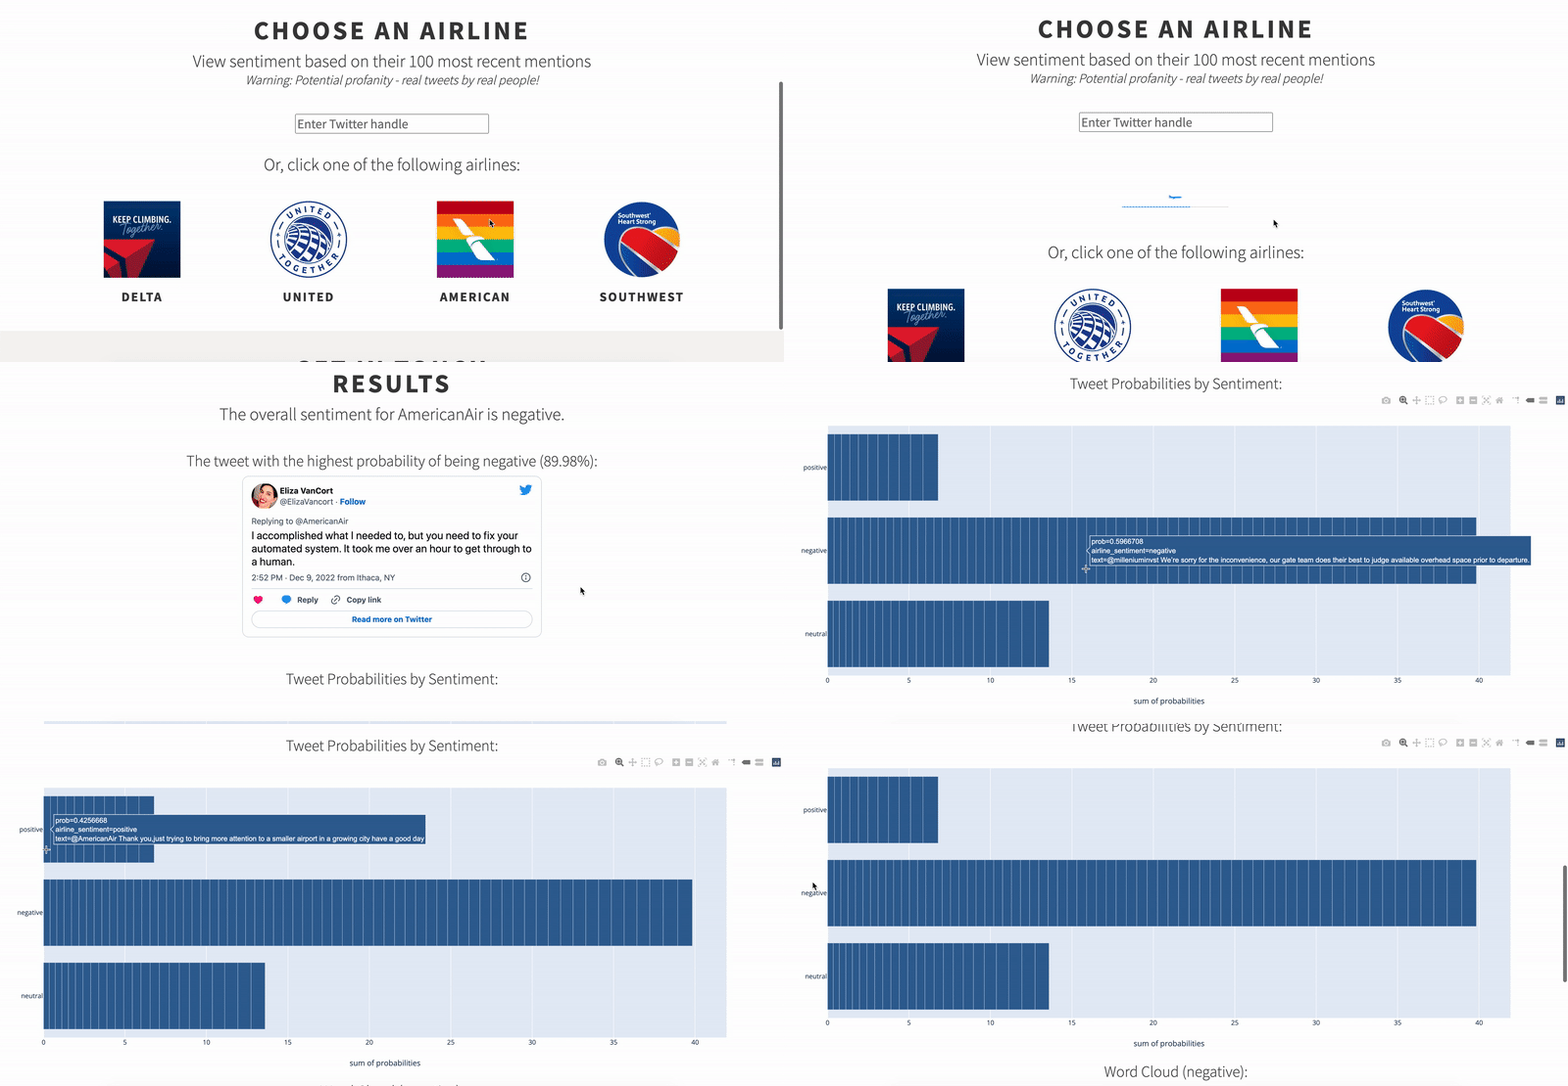
This was my second capstone project for the Springboard Data Science bootcamp. The goal was to train a model to predict sentiment and develop a web app that can be used to monitor the current sentiment of various airlines day-to-day and display representative tweets. The major phases were data cleaning, exploratory analysis, training the model, and developing the web app. During this project, I was able to learn some methods to deploying a machine learning model to a web app and some basic web development skills!
This page contains a high level overview, but a more detailed report can be found here.
The design was TwoColours, a free, fully standards-compliant CSS template designed by TEMPLATED. The website was previously hosted on Heroku, but has been taken down since they removed their free account tier; I was already paying $5 a month on Git LFS storage for the models. :(
Stack
Python (pandas, NumPy, matplotlib, seaborn, nltk, scikit-learn, Flask, Plotly, Tweepy), Heroku
Data Sources
The data came from Figure Eight, who provides high quality training data to solve various machine learning problems, and can be found here. Once the model was trained, Twitter data came from the API to determine the current sentiment of different airlines.
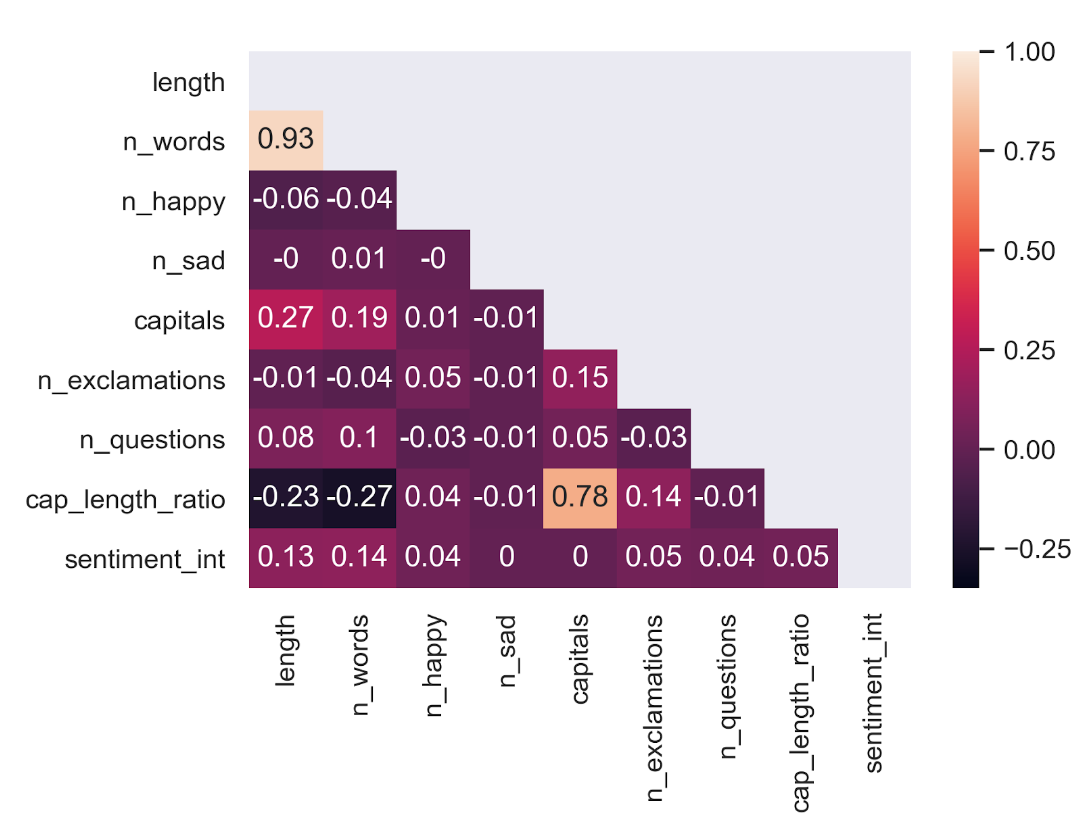
Additional features were created from the original tweets: the total character count, the number of capital letters, the capital letter to character count ratio, the number of words, the number of happy emoticons, the number of sad emoticons, the number of exclamation marks, and the number of question marks.
Exploratory Data Analysis
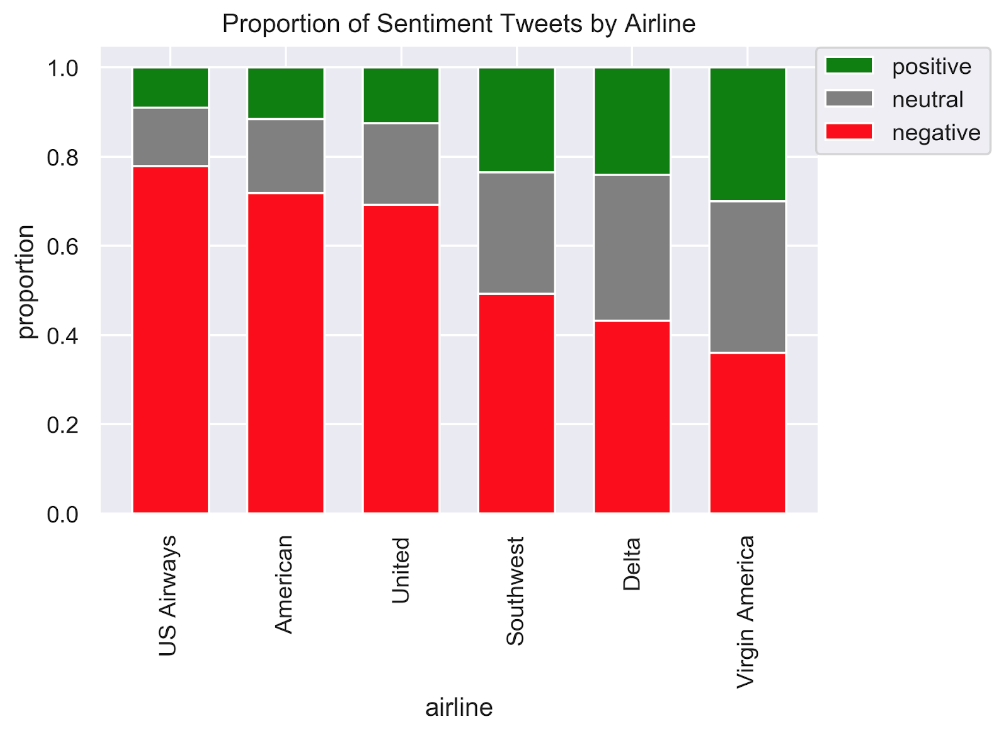
Unsurprisingly, the general trend was that most people tweeted about an airline for negative reasons. Positive and neutral tweets were much less common, which likely impacted the model's accuracy due to imbalanced classes.
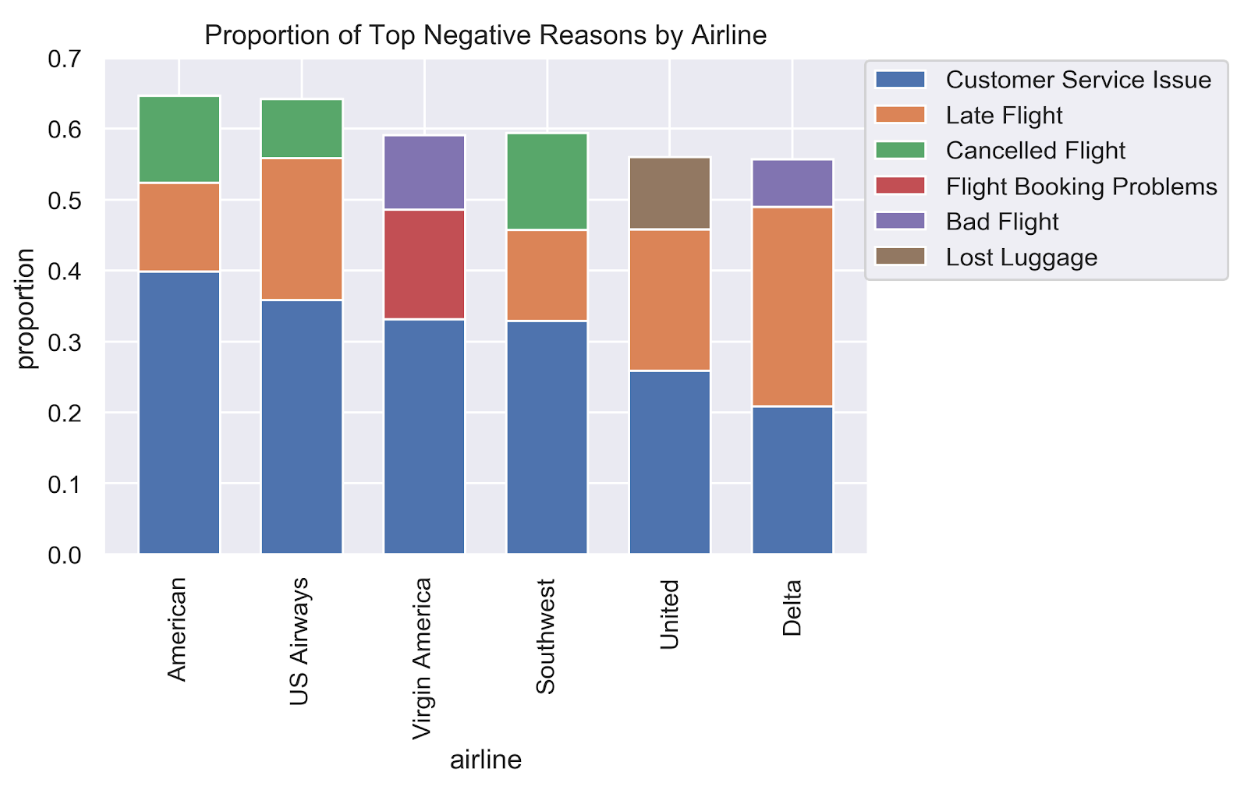
For all airlines, customer service issues were a consistent problem. However, it should be noted that it was not the most frequent negative reason for Delta, which was late flights. America, Southwest, and US Airways also had common complaints regarding cancelled flights. Virgin America and Delta differed from the other airlines because their third top reason was about bad flights.
The following image is the correlation matrix. The correlation values for sentiment_int vs. the other features were calculated using the correlation ratio, which ranges from 0 to 1.
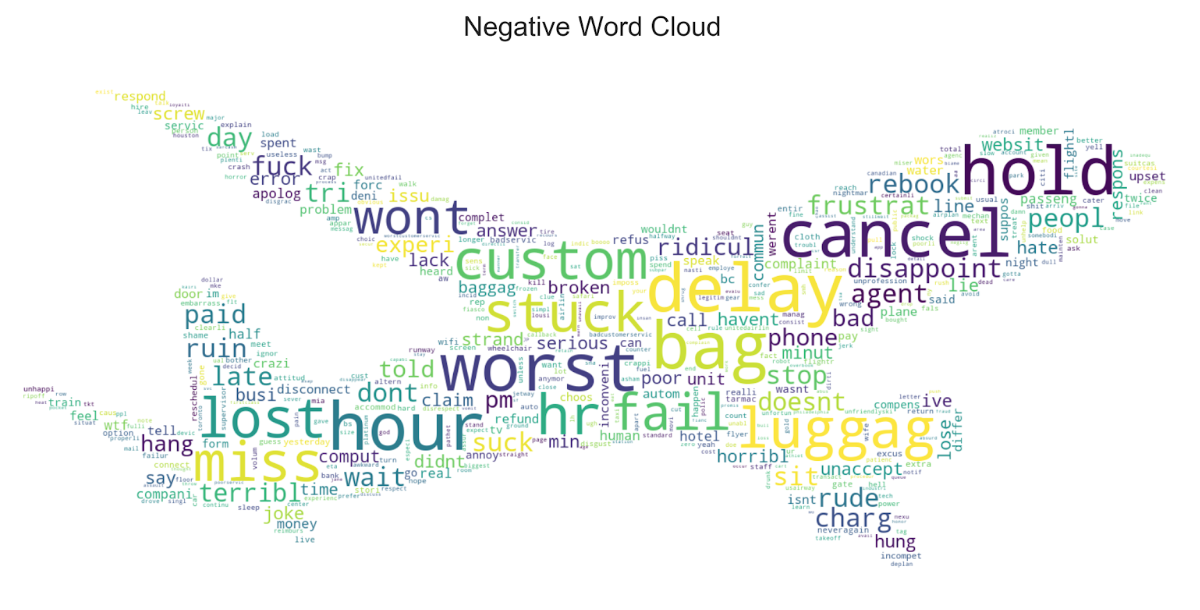
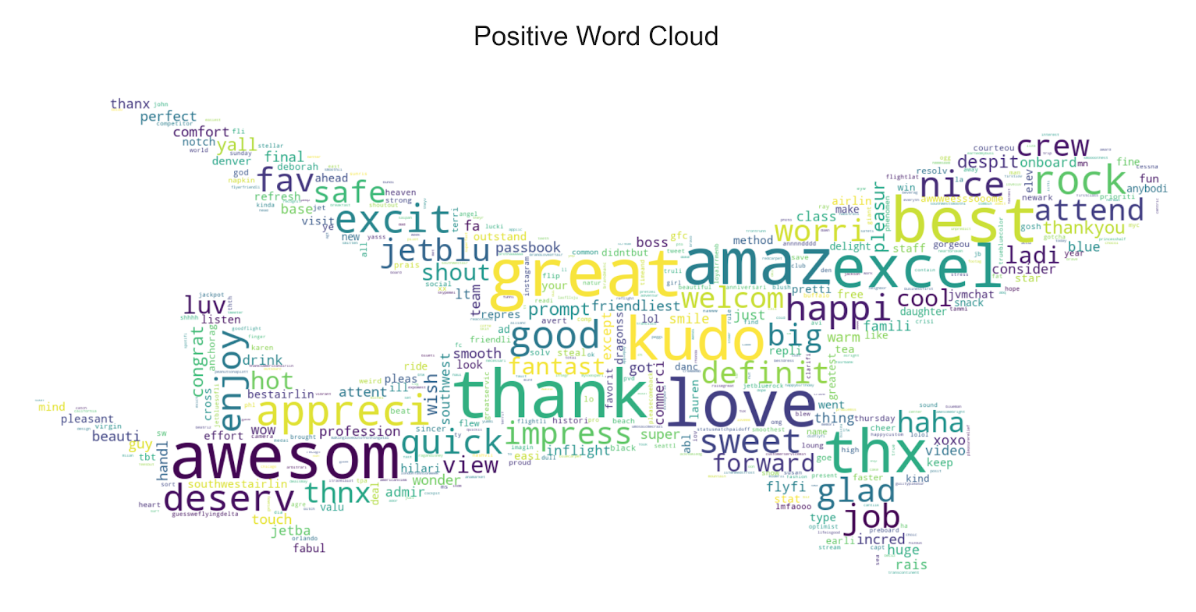
Model
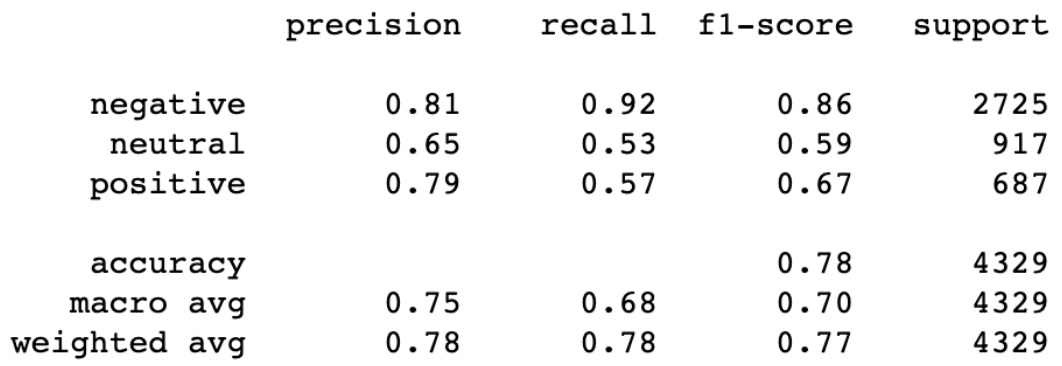
Two classification algorithms were used to compare performance with tf-idf vectorizer: Naive Bayes and random forest. Naive Bayes performed significantly worse than random forest; the mean accuracy score for Naive Bayes was 0.679 versus 0.763 for random forest. The bag-of-words model was then compared to tf-idf, which had a mean accuracy score of 0.757 vs. 0.763 for tf-idf. The hyperparameters for the final model were optimized using randomized search.
Issues and Potential Improvements
- Didn't have any web development experience prior to this project, so that was a little bit of a learning curve (mainly figuring out Flask and Heroku since the design was primarily from a template)
- Ran into issues with the file sizes of the pickled models when trying to upload them to Github (had to pay for a data pack to use Git LFS storage in order to upload them)
- Somewhat of a performance issue once the website was live because the Heroku dyno was much slower than my machine, so the model took longer to predict sentiment (not a great user experience)
- The model could also certainly use improvements since there was not much data for neutral and positive tweets, so it didn't perform as well for those