Predicting flood events
in Louisiana
First Springboard Capstone Project - June 2020
Purpose and Goal
This was my first capstone project for the Springboard Data Science bootcamp. The goal was to build a model that is capable of taking in forecast data and return the likelihood of a flood event occurring in Louisiana. The major phases were data cleaning, exploratory analysis, and training the model.
This page contains a high level overview, but a more detailed report can be found here.
Stack
Python (pandas, NumPy, pandarallel, seaborn, matplotlib, BeautifulSoup, requests, SciPy, scikit-learn), SQLite
Data Sources
NWS provided storm data containing statistics on personal injuries and damage estimates from 1950 to present. There were 34 different storm events including various types of floods, hurricanes, thunderstorms, hail, etc. There were 51 columns including damage, injuries, deaths, etc. I used Python scripts to download all 213 csv files, create a database, and ingest the data into the database.
Additional supporting data included historical meteorological data to analyze any potential correlations. NOAA's National Centers for Environmental Information had Daily Summaries data at numerous stations across the United States. This data included air temperature, precipitation, and wind speed.
Exploratory Data Analysis
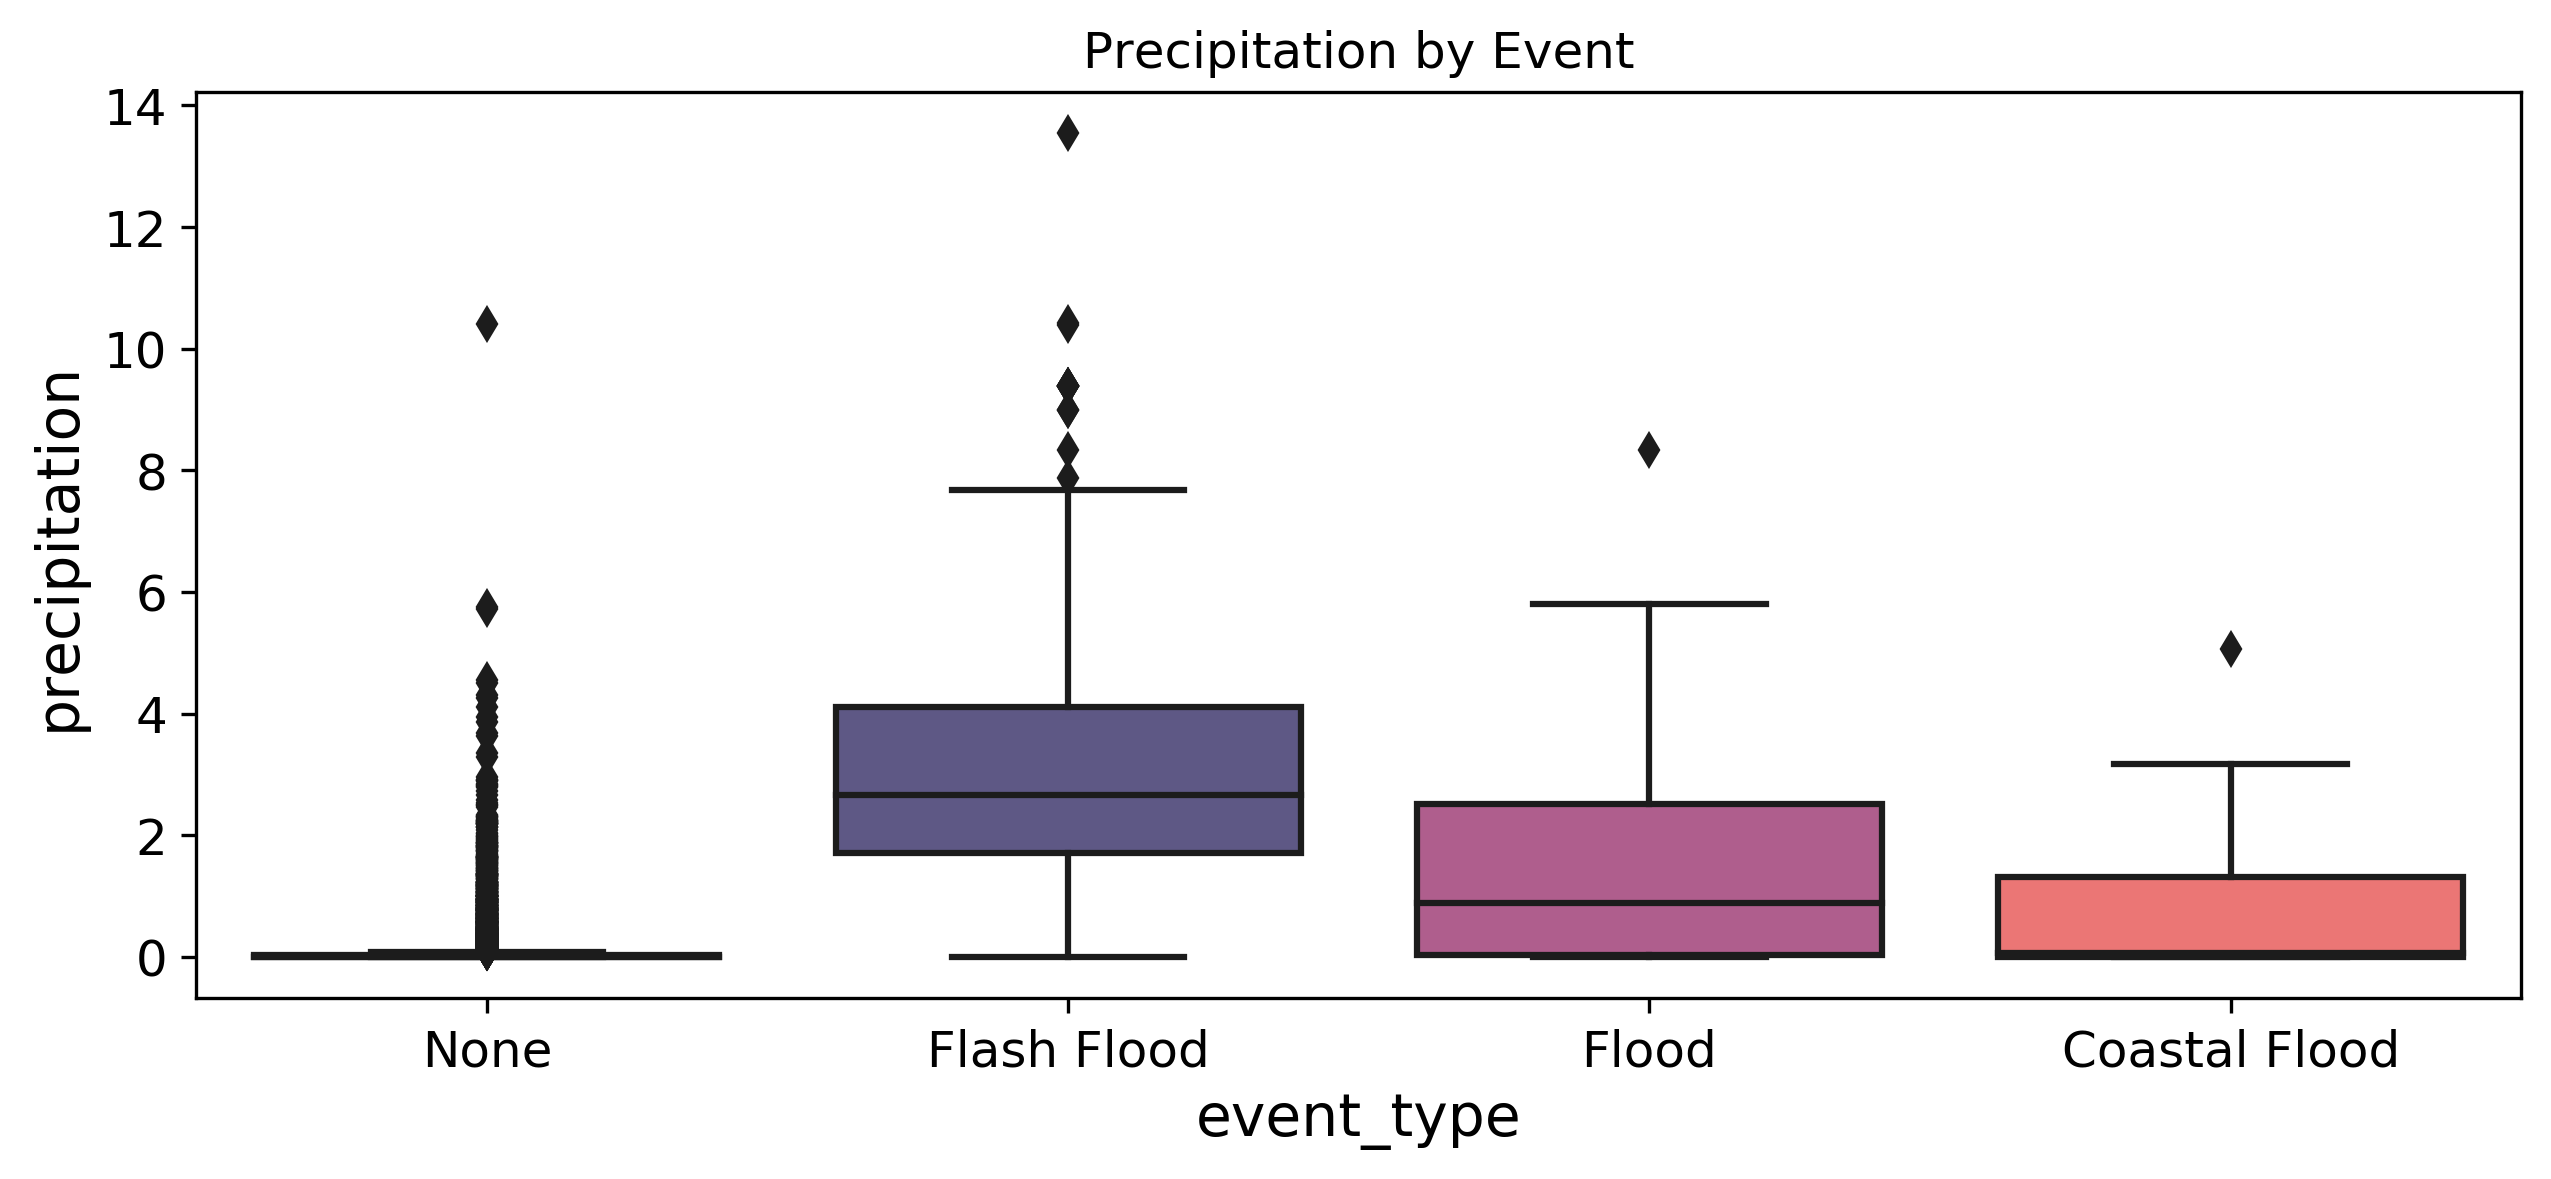
There were 668 flash floods, 132 floods, and 11 coastal floods in the dataset. NWS provided documentation defining the storm events recorded in the database.
- flash flood: life-threatening, rapid rise of water into a normally dry area beginning within minutes to multiple hours of the causative event (e.g., intense rainfall, dam failure, ice jam)
- flood: any high flow, overflow, or inundation by water which causes damage
- coastal flood: flooding of coastal areas due to vertical rise above normal water level caused by strong, persistent onshore wind, high astronomical tide, and/or low atmospheric pressure
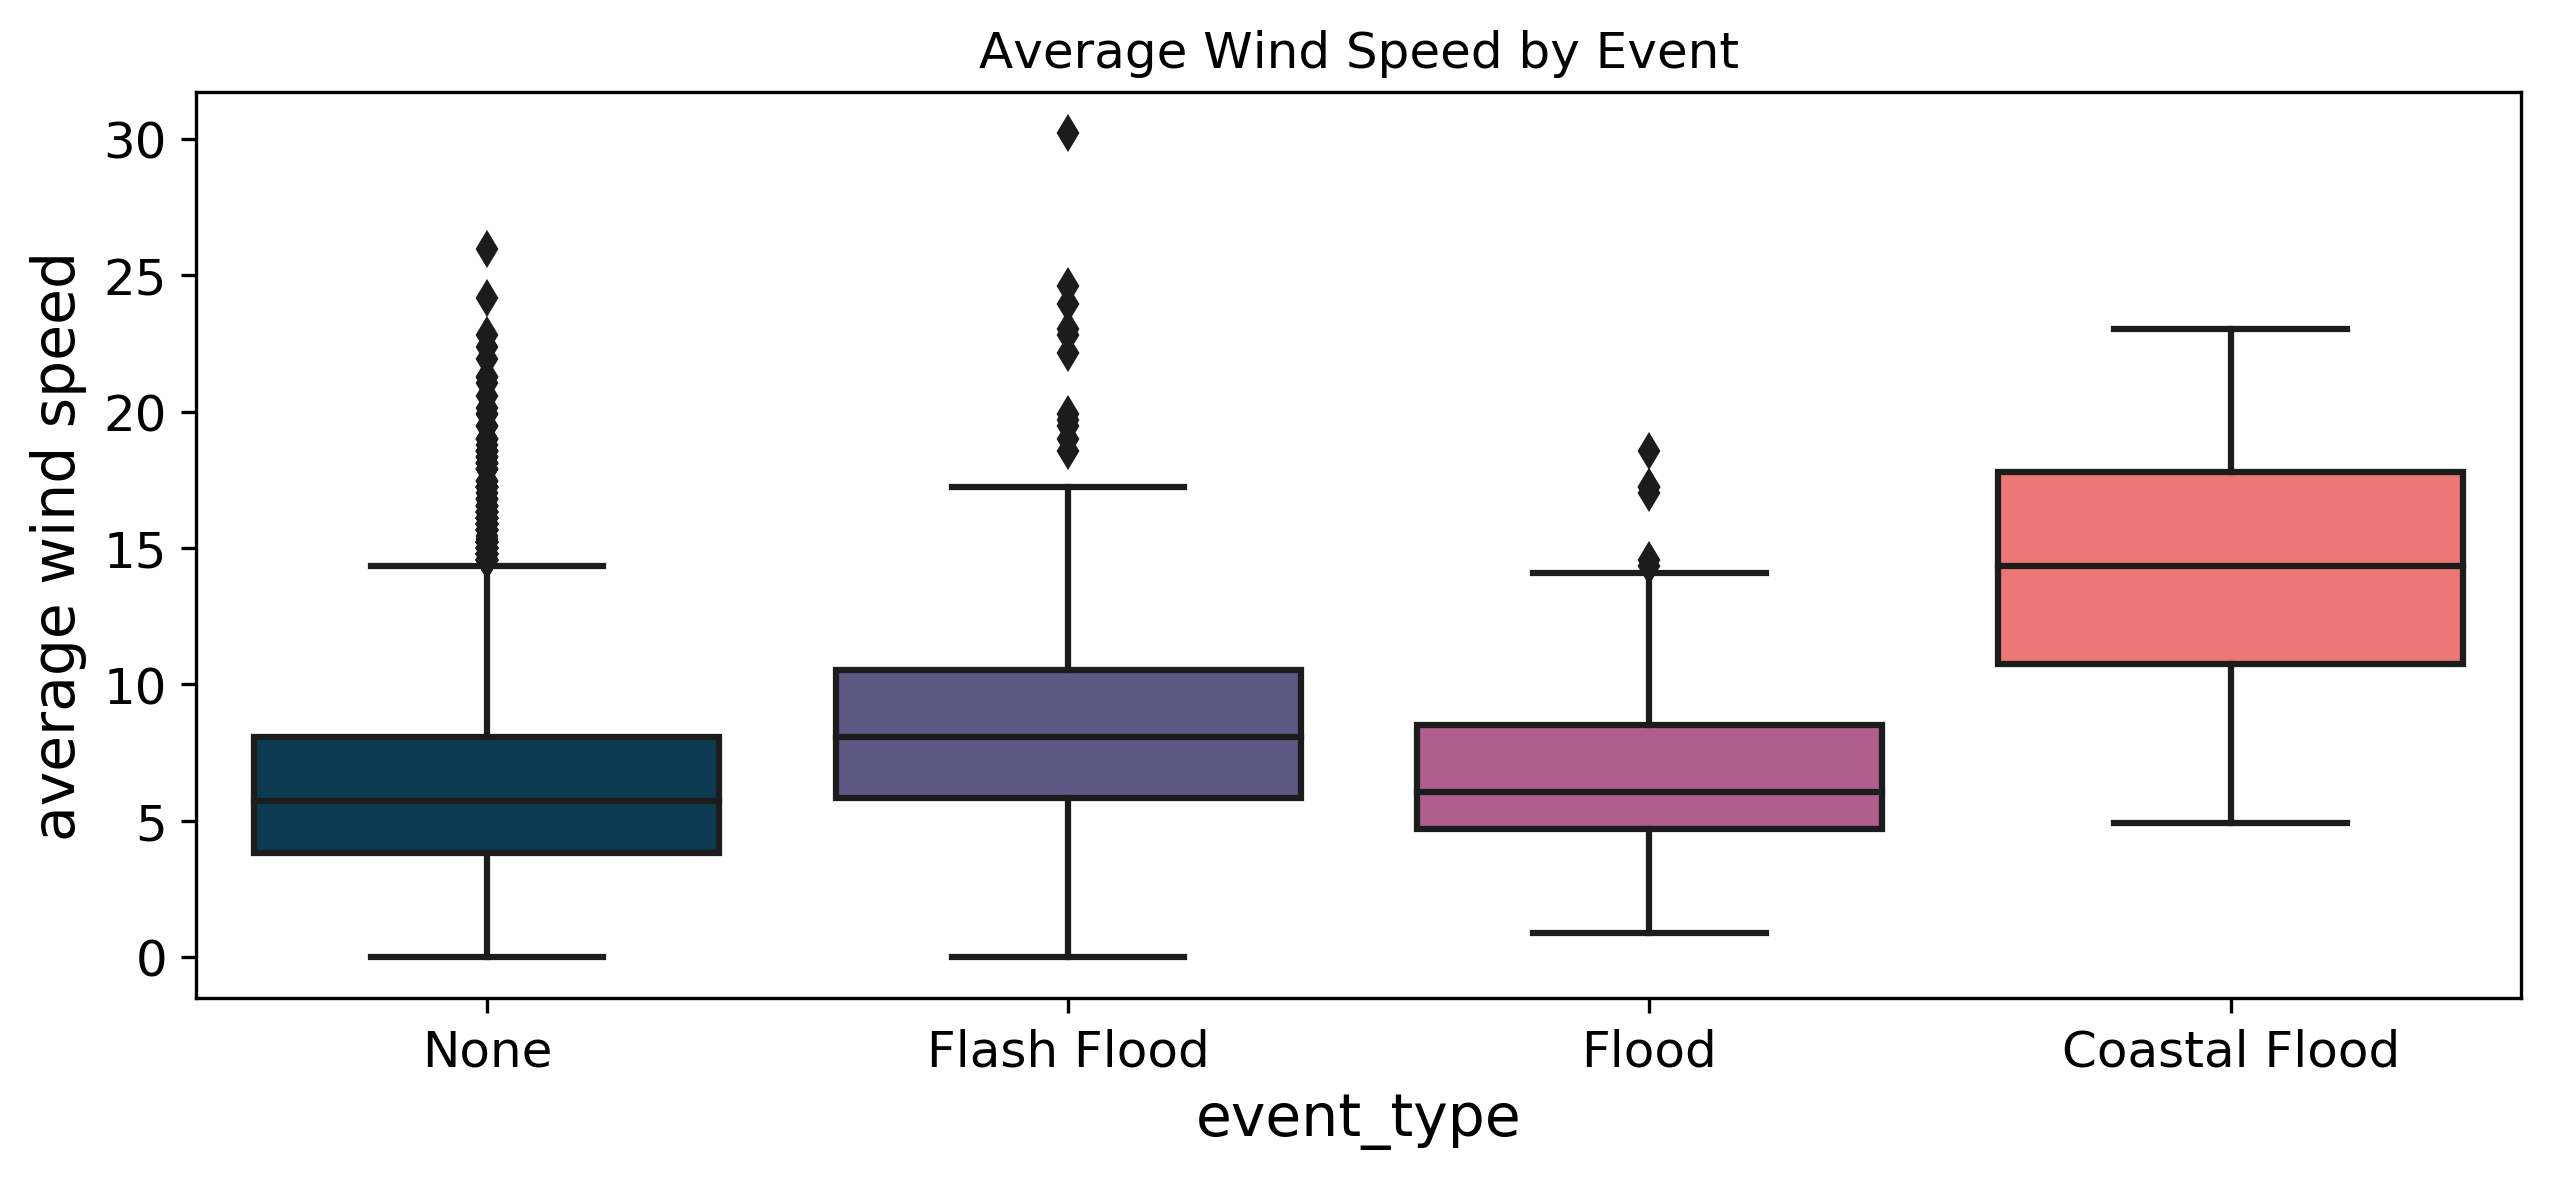
Wind speed was another anticipated feature of interest because these events are caused by coastal processes such as waves, tides, and storm surges, which are strongly influenced by wind.
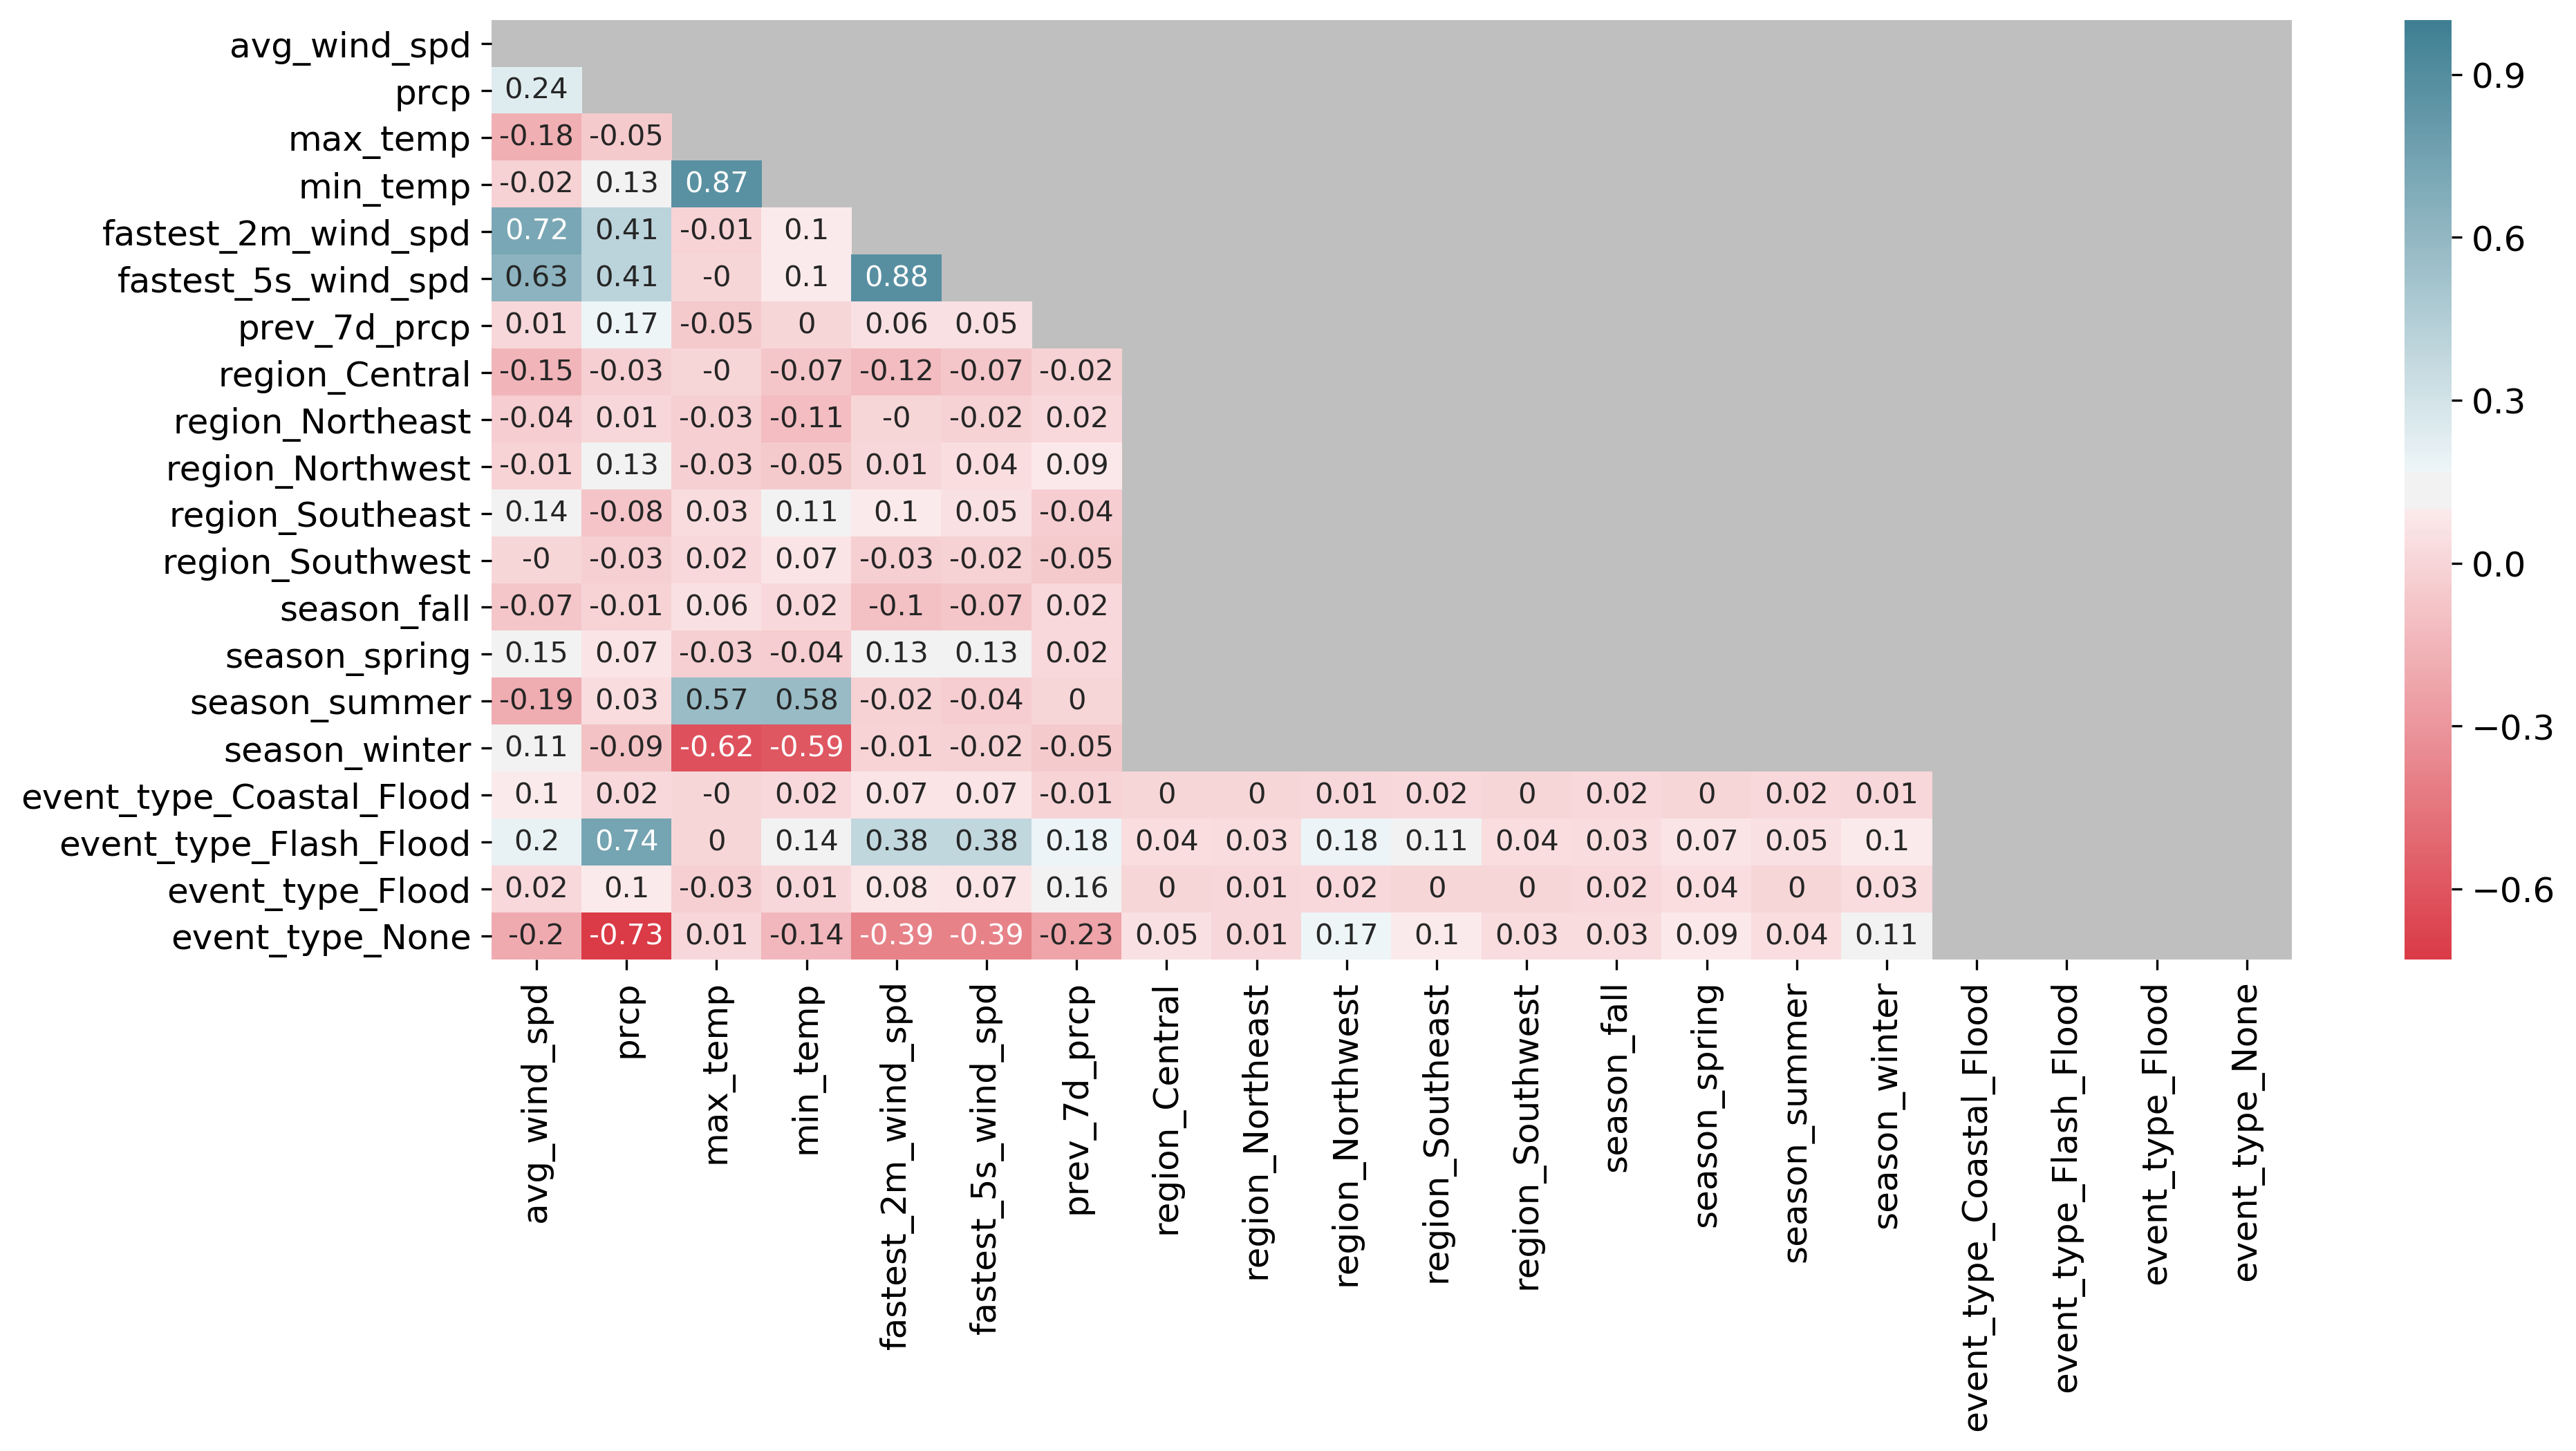
The following image is the correlation matrix. The grey area indicates relationships that are with themselves (e.g., `avg_wind_spd` vs. `avg_wind_spd`, etc.), relationships that are nonsensical (e.g., region vs. season, etc.), or repeating values (e.g., `prcp` vs. `avg_wind_spd` shown only once). Any relationships that were not statistically significant were also greyed out.
Model
Two classification algorithms were used: logistic regression and random forest. Both algorithms were beneficial because they are both generally easy to interpret, allowing for easier stakeholder communication. Logistic regression was selected because it is the go-to method for binary classification problems. Random forest was selected because it works well with fitting categorical features and high dimensional data. Random forest performed the best with an F-2 score of 0.839 compared to logistic regression’s F-2 score of 0.836. Hyperparameter tuning was done with cross-validated grid search.
| precision | recall | f1-score | support | |
| no flood | 0.98 | 0.95 | 0.96 | 1247 |
| flood | 0.74 | 0.87 | 0.80 | 203 |
| accuracy | 0.94 | 1450 | ||
| macro avg | 0.86 | 0.91 | 0.88 | 1450 |
| weighted avg | 0.94 | 0.94 | 0.94 | 1450 |
Issues and Potential Improvements
Data cleaning and joining the two data sets together were the trickiest parts of this project.
- The storm events data used parish to indicate location of the event, but several data points were not exact parish names and had to be cleaned to be one of the distinct 64 parishes in the state
- The meteorological data did not include parishes for each station, which was how I joined it with the storm events data. Had to use an API to query for each parish based on coordinates of each station. Then the station data was aggregated to represent the parish in its entirety by taking the mean of all data points for stations within each station for each date
- The data was sparse; when the storm events and meteorological data were joined, there were only 2,202 flood events, of which only 812 data points had complete meteorological data. A better data set would improve the model's capability to predict flood events
Further data exploration could be done in order to find other data sources or potentially feature engineering to strengthen the model. Predictive weather models are exceptionally complex, and there is likely much more that can be done to develop a stronger model with a higher F-2 score. Additionally, a web application could be developed to allow access for use by stakeholders.